On High-Range Test Construction 23: Hindemburg Melão Jr., A Ratio Scale for Cognitive Testing

Publisher: In-Sight Publishing
Publisher Founding: March 1, 2014
Web Domain: http://www.in-sightpublishing.com
Location: Fort Langley, Township of Langley, British Columbia, Canada
Journal: In-Sight: Independent Interview-Based Journal
Journal Founding: August 2, 2012
Frequency: Three (3) Times Per Year
Review Status: Non-Peer-Reviewed
Access: Electronic/Digital & Open Access
Fees: None (Free)
Volume Numbering: 13
Issue Numbering: 1
Section: E
Theme Type: Idea
Theme Premise: “Outliers and Outsiders”
Theme Part: 32
Formal Sub-Theme: High-Range Test Construction
Individual Publication Date: November 22, 2024
Issue Publication Date: January 1, 2025
Author(s): Hindemburg Melão Jr.
Word Count: 11,191
Image Credits: Hindemburg Melão Jr.
International Standard Serial Number (ISSN): 2369-6885
Please see the footnotes, bibliography, and citations, after the publication.*
Abstract
Hindemburg Melão Jr. is the author of solutions to scientific and mathematical problems that have remained unsolved for decades or centuries, including improvements on works by 5 Nobel laureates, holder of a world record in longest announced checkmate in blindfold simultaneous chess games, registered in the Guinness Book 1998, author of the Sigma Test Extended and founder of some high IQ societies. Melão Jr. discussed the limitations of traditional IQ measurement methods, which use an ordinal scale that restricts statistical operations and distorts high-level scores. He introduced a method in 2003 to place IQ scores on a ratio scale, termed potential IQ (pIQ), providing consistent intervals and accurate proportional comparisons. This approach aimed to correct distortions in traditional methods like Wechsler’s, which impose a constant standard deviation. The updated method in 2024 involved revising norms for IQ tests like the Mega and Titan, aiming for more precise high-range assessments. The concept allows for enhanced analysis and accurate determination of rarity levels.
Keywords: High-range assessments, IQ measurement, potential IQ (pIQ), rarity levels, ratio scale, statistical analysis, Wechsler method.
On High-Range Test Construction 23: Hindemburg Melão Jr., A Ratio Scale for Cognitive Testing
In Measure Theory, there are 4 scales with different levels of information: categorical, ordinal, interval, and ratio. The scores in IQ tests, as they are currently measured, are on an ordinal scale. This imposes many limitations regarding the statistical treatments that can be applied to these results. One can only determine whether an IQ score is higher or lower than another, but it is not possible to accurately determine differences, proportions, or perform any arithmetic operations between the scores. The Celsius temperature scale, for example, is approximately on an interval scale, allowing for the measurement of temperature differences, but it does not allow for the calculation of proportions. The Kelvin scale is on a ratio scale, enabling the calculation of differences, proportions, and all other arithmetic operations.
For this reason, for decades, the creation of a method to measure IQ on a ratio scale has been the “Holy Grail” of Psychometrics, as it would solve a wide range of distortions in test scores, contribute to the improvement of reliability and accuracy of the results, eliminate some inconsistencies, and confer greater scientific status to the concept of “IQ.”
In 2003, I published an article in which I solved this problem. The original version can be found at:https://web.archive.org/web/20060504005149/http://www.sigmasociety.com/artigos/norma_setembro_2003.pdf
These are the opinions of some members of high IQ communities about this article:http://www.sigmasociety.com/sigma_comentario-novo.asp
My article is in Portuguese, and the only source in which it was published is the Sigma Society website, so it did not gain traction, and thus, less efficient methods continue to be used in the standardization and normalization process of tests.
With the reactivation of Sigma Society in 2022, I considered revising and updating the 2003 article, but I later preferred to write a different article, describing the method in slightly more appropriate language while preserving the original idea. Recently (July 2024), I was interviewed by Scott Jacobson in the In-Sight Journal about test construction, and he suggested including the 2003 article as part of the interview. Therefore, I decided to create a new update, especially in the parameter values. We tried to obtain the raw data from the Mega Test and Titan Test, with Ronald Hoeflin, to also update the norms for these tests that we had calculated in 2003, but Hoeflin has been more distant from the Internet and has not yet responded. Thus, we made this update now, and if we receive the complete raw data in the future, we may create a new norm for Mega and Titan.
This standardization process has important advantages compared to previous methods, generating more accurate scores, even from smaller samples, and enabling a wide range of analyses that were not possible with the existing methods until then. An example: if it were possible to sum the intelligence of all the people who have ever been born into a single person, what would that person’s IQ be? Or: considering all the people who work at Google, what would the institutional IQ of this company be, that is, the level of intellectual production of Google would be equivalent to the IQ of a person at what level? With the normalization method used in the Sigma Test starting in 2003, it becomes possible to answer this question and many others involving proportions between IQs and more sophisticated operations. Another question that can now be answered by this method is: “What is the probability that a person with an IQ of 150 would solve a question that 50% of people with an IQ of 120 would get right?” Of course, this also works for any other values instead of 150, 120, and 50%. The answer was possible for a particular test, but with this standardization method, it can be answered for any problem.
To read the original 2003 article, visit the link mentioned above. In the original text, there are some errors and positions that no longer reflect my current opinion on this subject, but, in essence, the central idea described in that text retains its validity practically intact.
In this current article, I will make some minor revisions to certain details of the original text and will attempt to present the concepts of pIQ and rIQ more clearly and didactically. Next, I will comment on some of the main home tests, what they actually measure, what the differences are between their real ceilings and nominal ceilings, and, most importantly, what the true level of rarity is for each IQ range above 130, especially at the highest levels.
If you believe that a person with a score of 196 on a standardized IQ test with a mean of 100 and a standard deviation of 16 is truly at a rarity level of 1 in 1 billion, you will probably revise your opinion after reading this article. If you do not believe this but would not know how to evaluate what the correct rarity level for that IQ range would be, you will find suitable answers in this article. Certainly, the results presented here are neither conclusive nor exact, but they provide a more realistic and factually grounded view, with a higher probability of being close to the “truth,” or at least the “truth” from the perspective of sentient reality.
First, we will define “rarity IQ,” “age IQ,” and “potential IQ.” The latter is a “new” concept, which I first presented in 2003 and is essential for examining this issue properly. The other two concepts are older but are often interpreted inadequately, so I will briefly discuss this matter before addressing the problem itself, reviewing these concepts, and introducing more appropriate terminology from an etymological point of view.
Concepts of potential IQ (pIQ), rarity IQ (rIQ), age IQ (aIQ):
Age-IQ (aIQ):
The original concept of IQ was introduced by Alfred Binet, Theodore Simon, William Stern, and Lewis Terman, and it represented the division of mental age by chronological age, multiplying the result by a factor of 100. Binet understood that the term “mental age” was not appropriate and preferred the term “mental level.” However, after Binet’s death, the term “mental age” became established through common use.
There are several problems with this concept. For example: the IQ of a child with a chronological age of 10 years and a mental age of 15 years is 150, just as the IQ of a child with a chronological age of 5 years and a mental age of 7.5 years is also 150. However, when these children’s IQs are assessed in adulthood, it is found that both have less than 150. This occurs because the development of intelligence with age is not linear.
The “real” curve of intelligence development as a function of age is quite different from a straight line and is also not the same for different IQ ranges. The two graphs below show our 2024 model for curves, and the article explaining the meanings of the terms used in STL provides a more detailed explanation about the variation of intelligence with age, as well as critical analyses of the adjustments used in WAIS and others. This article can be found at https://www.sigmasociety.net/artigo/significados-stl.


As we can see, the real curve is very different from a straight line and does not reach its limit exactly at 16 years of age, nor does it remain stable throughout life.
In the WAIS, the results of each subtest are also considered separately, showing that the curves are not the same across these subtests. However, there are several issues with the WAIS, some of which I discuss in a specific article, in The Golden Book of Intelligence, and in volume 5 of The Apodictic Guide.
Similar curves of intelligence development as a function of age are observed in various other studies, even without the use of IQ tests, such as in the case of Chess ratings as a function of age.
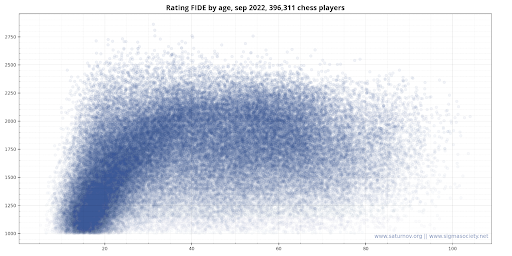
For more details, see my article on the suspected fraud involving Niemann against Carlsen and the article describing the meanings of the terms used in the STL report. https://www.sigmasociety.net/artigo/niemannxcarlsen
We will use the term “age-IQ” or “aIQ” to represent this concept of IQ (the division of mental age by chronological age).
Some authors use the term “ratio-IQ,” which I do not consider appropriate as it does not specify the ratio between which variables are being considered. It could imply a ratio in the sense of “rarity,” which would create confusion.
Rarity-IQ (rIQ):
The method developed by Stern and Terman for calculating IQ based on the division of mental age by chronological age had distortions, because the development of intelligence as a function of age is not linear. In the 1930s, David Wechsler contributed to solving part of this problem by standardizing scores for each age group based on rarity. Thus, a 5-year-old child scoring higher than 99.87% of other children of the same age would have an IQ of 145 or a z-score of +3σ, and a 10-year-old child scoring higher than 99.87% of peers would also have an IQ of 145 or a z-score of +3σ. This eliminates the need to understand how intelligence varies with age, allowing for the measurement and modeling of this variation with age, among other advantages. Therefore, the method used by Wechsler for IQ test normalization remains the most used today, although there have been better methods available since 1950 and particularly since 2003.
At first glance, Wechsler’s approach to addressing how to measure intelligence on a more standardized scale appears better than Binet’s method and, in fact, is better in some respects, but worse in others, still presenting significant distortions.
One of the problems is that the “true” standard deviation of ability levels at age 5 is not the same as the “true” standard deviation at age 10, 16, or in adulthood. The distribution of intellectual levels varies with age, but Wechsler attempts to impose a constant distribution. To understand the implications of this error, one can compare it to height. The standard deviation for adult height is about 7.1 cm, while for 12-year-old adolescents, it is about 6.3 cm, and for 7-year-old children, it is 5.0 cm. There is a real variation in the true standard deviation depending on age, and imposing a constant standard deviation, such as 5 cm for all ages, would distort all scales, causing multiple issues of inconsistency, limiting procedures, and skewing calculations. This is what Wechsler did by imposing an artificial standard deviation of 15 for the distribution of IQs across all age groups.
In adulthood, the standard deviation ranges from 15.64 ±0.18 to 16.39 ±0.19. If one selects an age reference of 17.61 ± 0.34 years, the deviation is almost exactly 16.00 ±0.11. Moreover, if the weighted average IQ over a lifetime is calculated in 2022, this average corresponds to the intellectual level achieved at 17.44 ± 0.29 years. Thus, a standard deviation value of 16 can be adopted, with the reference age standardized at 17.5 years, as this age represents the lifetime average IQ. For other ages, IQ can be adjusted using the curves presented earlier. This approach avoids distortions, as it does not impose any arbitrary values but uses empirically obtained real values. It also does not force other age groups to have distributions with a specific standard deviation but calculates lifetime IQ based on the correction of the IQ at the age of examination. Since this lifetime IQ typically occurs at 17.5 years, it is correctly positioned in the spectrum where the standard deviation is 16. However, these are not the main points. The most crucial aspect is the way pIQ is conceptualized and calculated, allowing for the production of scores on a ratio scale.
Another problem with Wechsler’s methods is that when the number of people examined is around 1,000, it ensures an accurate measure of rarity up to 3 standard deviations above or below the mean, but one cannot attempt to extrapolate rarity estimates much beyond this range based solely on these data. This is because the distribution tails are often denser than in a normal distribution, and this relative density increases further from the mean. Therefore, even if the curve fits well within the -3σ to +3σ range, it does not guarantee a good fit outside this interval, and, in fact, it does not.
Another problem is that scores forced to fit a scale based on rarity do not preserve certain desirable properties, such as interval consistency, which has several negative implications. Let’s analyze just one of them:
Suppose a similar method were used to measure people’s height. In a group of 1,000 people, it is found that the distribution of heights is well represented by a normal distribution with a mean of 1.70 m and a standard deviation of 0.07 m. The same method proposed by David Wechsler is then adopted to measure height, that is, the level of rarity of people above or below a certain height or percentile is determined, this rarity or percentile is converted into a corresponding number of standard deviations above or below the mean, and then the height is calculated by adding that number of standard deviations to the population’s average height. For example: if a person is above 97.7% of the population, they are 2 standard deviations above the mean, so their height should be 2 × 0.07 m + 1.70 m = 1.84 m. Indeed, people above 97.7% in a population with an average of 1.70 m generally have a height of approximately 1.84 m. The same works well for 95%, 90%, 80%, 60%, etc. The problem arises when the percentile is much higher than 98% and especially above 99.9%. Let’s consider some extreme cases for clarity:
Following Wechsler’s procedure, one might determine that the tallest person recorded in history was 6.7 standard deviations above the mean, as 6.7 standard deviations correspond to the theoretical rarity level of 1/95,960,292,510. However, 6.7 standard deviations above the mean translates to 6.7 × 0.07 m + 1.70 m = 2.169 m. This implies that the tallest person in the world would be less than 2.17 m tall. This is a gross error because the tallest person recorded in history was 2.72 m tall, or 14.57 standard deviations above the mean. If the distribution of heights were normal, the probability of someone being 2.72 m tall would be less than 1 in 4.7 × 10^47. Thus, it is evident that this method produces grossly incorrect results when applied outside the -2σ to +2σ range.
In addition to being incorrect, the results are also inconsistent, which is even worse. If the values were merely incorrect but at least all errors were positioned well on an interval or ratio scale, some comparisons could be made without significant distortion. However, this is not possible (it is possible, but the comparisons are grossly distorted). To better understand this problem, consider the following situation: if height measurements were forced to fit a normal distribution, the value of 1 cm in the height range from 2.16 m to 2.17 m would be very different from 1 cm in the range from 1.70 m to 1.71 m. This would compromise the uniformity of scale intervals and distort proportional measurements using that scale. The value of 1 cm would not have the same length in different regions of the scale, which is a highly undesirable property. The scale is the “ruler” used for measurement. Measurements can obviously vary freely; a car can move at 100 km/h in one part of its path and 120 km/h in another. However, it is unreasonable to use 1 km with a length 20% greater in one part of the track (1 km = 1.2 km) to force the car’s speed to appear constant at 100 km/h. Treating 1 km as 1.2 km in different parts of the track is a severe inconsistency. What Wechsler does is exactly equivalent to this.
I mentioned the example of the intervals near 2.16 m and 1.70 m, but the distortion is present throughout the entire scale. The value of 1 cm would not be the same in different parts of the scale. This has serious and profound implications, as we will see later. Of course, there are some differences between measuring IQ and measuring lengths, because in the case of length, there is a well-established and well-known scale, while in the case of IQ scores, we were (and still are) in the phase of discovering how things work. The problem is that if a method is adopted that forces distortion onto the scale, it becomes impossible to progress in understanding and developing more complete and accurate methods. Therefore, one of the first necessary steps is precisely to correct the scale so that we can then work with a consistent metric.
We will use the term “rarity-IQ” or “rIQ” to represent the concept of IQ equivalent to a given level of theoretical rarity. This has been the concept used since Wechsler in the 1930s. As we have seen above, it is equivalent to using “rarity height,” which is a false and distorted measure of height, estimated based on the percentile of people who reach a certain height, instead of considering the true distance between the soles of the feet and the top of the head with the person standing upright.
Some authors use the term “deviation-IQ” to represent this concept, but this is not appropriate. The correct meaning of “deviation-IQ” is the number of standard deviations multiplied by the value of the standard deviation of the considered variable. In the case of IQ, it is multiplied by 16. This is not the same as IQ corresponding to a certain level of rarity. It would only be the same if the distribution were normal throughout the entire spectrum. The deviation-IQ is actually similar to pIQ, although not exactly, because the conceptual meaning of pIQ is different, but numerically they assume similar values.
Rarity-IQ does not represent deviation-IQ but rather the theoretical IQ corresponding to a certain level of rarity. Numerous experiments show that the real distribution of scores only adheres to a Gaussian distribution within the range of -2.5σ to +2.5σ. Outside this range, the tails are denser than in a normal distribution, so it cannot be said that a person who scored 160 (σ=15) is at the 99.997th percentile, based on a test with a distribution that has a mean of 100 and a standard deviation of 15 with 1,000 people. Even if the sample had 100,000 people or more, the score adjustment to rarity levels would be predominantly determined by the central mass of data between -2σ and +2σ, which contains more than 95% of the elements, having little sensitivity to the shape of the curve outside this range. What could be done is to adjust each score to each rarity level, in which case 160 could correspond to 1 in 30,000 or 99.997%, provided this was done during standardization. However, it would still be a distortion, for the reasons already explained, as the intervals would not be uniform.
Furthermore, the difficulty level of the questions would need to be appropriate for 160, and construct validity would need to be present at that level. This is not the case in the WAIS or in practically any other traditional IQ test, which is why these tests are not suitable for measuring IQs above +2σ or +2.5σ.
Other tests that use similar methods for standardization, such as LAIT, Mega, Titan, Ultra, and later ones, may have questions with an appropriate difficulty level to accurately measure up to about 165 or slightly higher, but they continue to face the problem of not establishing a correct correspondence between IQ and the true level of rarity. I published an article about this in 2002: “What is the true cut-off for high IQ societies?” Upon rereading that text, I noticed that the arguments I used at that time are outdated and no longer reflect my exact opinion, although, in essence, my opinion is almost the same. Therefore, I intend to write a better article on this, but in the meantime, it is recommended to read that one.
Potential-IQ (pIQ):
The ideal way to measure IQ would be on a scale where score intervals are equal in any region of the scale. A difference of 1 IQ point in the range from 100 to 101 should represent the same as the difference of 1 point in the range from 180 to 181 or between 36 and 37, or in any other region of the scale. Additionally, it would be desirable for IQs to be represented directly on a ratio scale or be directly convertible to a ratio scale.
A height of 1.80 m, for example, represents twice the height of 0.90 m. But an IQ of 180 does not represent twice the IQ of 90. The acoustic intensity of 50 dB is 100 times greater than the intensity of 30 dB, just as the acoustic intensity of 90 dB is 100 times greater than that of 70 dB, or 1,000 times greater than that of 60 dB, or 316 times the acoustic intensity of 65 dB. The measure of acoustic intensity is not directly on a ratio scale but is directly convertible to a ratio scale by taking the antilog of the values. Chess ratings are also not on a ratio scale but can be directly converted to one. This is an important and desirable property in any measurement process.
In the case of IQ, two problems need to be resolved: how to place scores on a consistent ratio scale and what the meaning of this “ratio” is, i.e., what the measurement represents as the “ratio between what?”
The first attempts to solve this problem were based on time. If a person completes a test in 75% of the allotted time, an extrapolation is made. Or based on age. But these simplistic views lead to gross and bizarre errors. If the test ceiling is 134 with a 40-minute time limit, but the person completes it in 20 minutes, it does not make sense to consider that 134×4020=268134×2040=268. This would be a very naive and highly unrealistic approach. It is necessary to first understand the properties of the scale and how the scores relate to each other in order to adjust them to a scale that allows for calculating proportions.
A temperature of 200º F is not twice that of 100º F, just as 20º C is not twice that of 10º C. To know the correct proportions, it is necessary first to convert to an appropriate scale, which in the case of temperature is the Kelvin scale. The points “0” and “100” on the Celsius and Fahrenheit scales were arbitrarily established based on the freezing and boiling points of water, or the melting point of ammonium chloride and the average body temperature. The Kelvin scale was established based on the relationship between temperature and gas pressure; it was observed that pressure varied linearly with temperature, and as there was a minimum limit of pressure (the vacuum), it was concluded that there would also be a minimum temperature limit. If a gas at 100º C has a pressure 1.3661 times higher than the same gas at 0º C, and if temperature varies linearly with pressure, the “true” 0 point of the scale should be 100×1.36611−1.3661=100=−273.15100×1−1.36611.3661=100=−273.15. There are some inaccuracies in this thesis, as pressure does not vary perfectly linearly with temperature, nor does it vary equally for all gases, nor is it appropriate to take pressure as a reference, but it was an important step in determining the approximate position of the true 0 point of the temperature scale. The advantage of this scale is that it allows statements like “200 K is indeed twice 100 K.” Additionally, these values can be squared, cubed, logarithms can be applied, and all other operations can be used.
In the case of Chess ratings, the situation is somewhat different, as the ratio scale arises from the antilog of the rating. A rating of 2000 is not twice that of 1000. The formula for finding the proportions is PaPb=10Ra–Rb400, where Pa and Pb are the probabilities of success for players “a” and “b,” while Ra and Rb are the ratings of those players. Thus, a player with a rating of 2000 has a much greater probability than 2:1 of defeating a player with a rating of 1000; more precisely, the probability is 316 times greater, or 316:1, meaning the player has a 99.68477% probability of success versus 0.31523%. In this context, one can say that the strength of “a” is 316 times greater than that of “b.” This is a consistent interpretation that preserves certain properties. For example: if A defeats B at a ratio of 3:1 and B defeats C at a ratio of 5:1, then A defeats C at a ratio of 15:1. Applying the rating formula, this works perfectly, and if these players face each other in a sufficiently large number of matches, it can also be experimentally verified that the proportions are approximately correct, with minor disparities due to repertoire, style, and other particularities. However, if considering 1,000 players from team A, 1,000 from team B, and 1,000 from team C, where team A players defeat team B players at a ratio of 3:1, and team B players defeat team C players at a ratio of 5:1, then team A players will defeat team C players at a ratio of 15:1, because in larger samples, individual peculiarities are diluted, and the effective proportions between strengths prevail.
Instead of trying to measure IQ proportions based on test completion times, which has been attempted many times and proven fruitless and distorted, an appropriate procedure seems to resemble what is done in Chess. The challenge is how to interpret this relationship, because in Chess, players compete against other players, whereas in tests, individuals face questions. My interpretation in 2003 was that it could be considered how many people with IQ = A would be needed to solve the same number of questions (or achieve the same score) as one individual with IQ = B, where B >> A.
In the 2003 article, I describe how standardization can be done to achieve this goal, resulting in a legitimate scale of potential ratio, with several notable features that make it superior to traditional scales. The main advantage is that the intervals on the scale are “correct,” providing a score independent of rarity, based on the proportion of potential. Then, true rarity can be calculated without imposing the false hypothesis that score distributions must be Gaussian. Another important advantage is that it allows scores to be generated with minimal uncertainty near the ceiling, even when there are few people in the standardization sample. Another advantage is that it produces more accurate scores by weighting the points of questions based on difficulty, with difficulty determined by the inverse of the number of correct answers. If a person accidentally misses an easy question but answers much more difficult ones correctly, the penalty for the oversight is minimal and practically does not affect the final result. If they get questions 5 to 25 correct on the ST and miss the first 4, the score is nearly the same (less than a 0.5-point difference) as if they answered all 25 correctly. This is consistent with the meaning of intelligence at the highest levels, where minor oversights and small errors are irrelevant. It is not important if Einstein made small errors in Euclidean Geometry or Arithmetic; this does not diminish his achievements in revolutionizing our understanding of Physics.
The solution for placing IQ scores on a ratio scale can be done in at least two ways:
- Converting IQs into Chess ratings and using the Elo formula to calculate the proportion between the probabilities of victory for those ratings.
- Calculating the proportions of how many people with each score correspond to one person with a higher score.
This is explained in more detail in the 2003 article.
Before proceeding, it is important to emphasize that determining IQ is not as straightforward as determining height or weight using a simple ratio scale like a ruler or a scale. Weight and height are natively on ratio scales, but IQ is not, nor is the Wechsler standardized score, the raw score from Binet—Stern—Terman, or any other score using traditionally utilized methods. Therefore, the first step is to place the scores on a ratio scale. However, there is no formula for this. It is necessary to interpret the properties of the variable being measured and create an appropriate method for converting the raw score obtained in the test into a score that is on a ratio scale or directly convertible to a ratio scale. The method I propose in this article does precisely that, producing pIQ scores, whose antilog is on a potential ratio scale.
Concept of “potential ratio”: If one person has an IQ of 100 and another has an IQ of 130, it is evident that one cannot say the person with an IQ of 130 is 1.3 times more intelligent or 30% more intelligent. The meaning of potential ratio is derived from the following relationship: if a person with a pIQ of 100 correctly answers 7 out of 30 questions in an intelligence test, while another person with a pIQ of 130 correctly answers 18 out of 30 questions on the same test, this does not reveal much about their comparative potential. Based on this data, it would be very wrong to say that a person with a pIQ of 130 is 18/7 times more intelligent than a person with a pIQ of 100 just because they answered 18/7 times more questions correctly. Considering the time each took to solve the same number of questions would be a less flawed approach but still inadequate.
The correct way to address this problem is as follows: if 20 people with a pIQ of 100, working independently on the same set of problems, can collectively solve 18 out of 30 (18/30) questions, while one person with a pIQ of 130 can also score 18/30, we can say that the potential of a person with a pIQ of 130 is equivalent to that of 20 people with a pIQ of 100, or 20 times greater than that of a person with a pIQ of 100, or that a person with a pIQ of 130 produces intellectually as much as 20 people with a pIQ of 100 combined.
Similarly, if a person with a pIQ of 160 solves 23 out of 30 questions, we can expect that 20 people with a pIQ of 130 combined could also solve 23/30, and 400 people with a pIQ of 100 could also solve 23/30. This is a very important detail because the difference between 160 and 130 is the same as the difference between 130 and 100; thus, the potential ratio must also be the same for the scale to be consistent and for the value of 1 IQ point to be the same in any region of the scale. For a more detailed discussion on this topic, see my book “Chess, the 2022 Best Players of All Time, Two New Rating Systems”, where I explain in detail why this property needs to be present for a psychometric instrument to be consistent. See also “The Golden Book of Intelligence”.
This hypothesis is well-founded and can be extensively confirmed in different ways. For example, based on data from over 70,000 chess players ranked by FIDE (2003), encompassing a total of 2,300,000 games played since 1971, the point proportions between players rated 2000 and 2400 are the same as those between players rated 2400 and 2800, or between 1200 and 1600. This holds true for any other region of the scale and any other difference. For instance, in matches between players rated 2175 and 1960, the results have the same proportion as those between players rated 2422 and 2207, because in both cases, the difference between the players is 215 points. This preserves the interval consistency of the scale.
Similarly, these proportions can also be verified among the scores of the Sigma Test. The total number of correct answers obtained by 20 people with scores between 125 and 135 (*), excluding repeated answers, is almost equal to the number of correct answers by one person with a score of 160. In other words, a person with a score of 160 can solve the same number of questions as 20 people with an average score of 130. This applies to any other IQ differences, maintaining a ratio of approximately 20:1 for every 30-point difference in score. When I mentioned the range of 125 to 135, it is important to note that the weighted average is not exactly 130, but I used this range as representative of a group with an average of 130 to simplify the explanation. To calculate the potential of a group with IQs between 125 and 135, one would first need to determine the potential of each member, calculate the arithmetic mean of their potentials, and then convert that value to pIQ. Assuming the scores between 125 and 135 are uniformly distributed, the average potential of this group would be equivalent to an IQ of 130.49302. If the scores in this group are distributed according to how IQs (pIQ) are found in the population, with all IQs rounded to whole numbers, the average potential would be equivalent to an IQ of 129.43614. Therefore, the error is small when considering 130, which simplifies the didactic presentation.
However, as we will see later, scores based on rarity-IQ fail in these predictions for ranges above 135, and if 20 people with an rIQ of 100 produce as much as 1 person with an rIQ of 130, the same proportion does not hold when comparing 20 people with an IQ of 130 to one with 160. Before this, it is necessary to correct the scale by converting rIQ to pIQ.
For IQ scores to be on a scale whose antilog is a ratio scale, pIQ must be measured, not rIQ. This is not a problem, as the vast majority of tests already measure pIQ, but they are incorrectly interpreted as measuring rIQ.
pIQ is the “natural score,” so to speak, calculated in result extrapolations when applying a test to a few hundred or a few thousand people and then estimating IQs for much larger rarity levels than the sample size. Therefore, pIQ has been extensively used for over 100 years, but it has been misinterpreted as rIQ, since the concept of pIQ did not exist until now.
The distribution of pIQ is not normal. It has a dense tail on the right. Therefore, the true level of rarity is different, and this difference becomes greater for higher IQs.
The term “pIQ” that we are introducing is a logarithmic measure that represents intellectual capacity. The difference ΔpIQ between pIQs relates to the proportion between the intellectual levels of individuals P1 and P2:
P1/P2=e^k∆pIQ
Where k≈1/0.09959k≈1/0.09959 (~10.041).
Representing IQs in the form of pIQ offers significant advantages over the use of rarity-IQ, not only because it allows for the extraction of information that would not be accessible by other methods and more accurate calculations of true levels of rarity, but also because it enables more accurate standardizations even with smaller sample sizes, among other conceptual and operational advantages.
To maintain similarity with traditional IQ (rIQ), pIQ values are calibrated primarily in the range of 70 to 130, where rIQs are very similar to pIQs. Outside this range, pIQ values gradually diverge from rIQ values, as rIQ values become increasingly distorted, while pIQ scores preserve interval consistency.
One important advantage of pIQ is that the ceiling of a test can be estimated based on the sum of the potentials of the people needed to solve all items. For example, a test with 50 questions where no one scored more than 42 correct answers, but only 2 questions were unanswered by all participants, can have its norm correctly calculated up to a raw score of 48, even if no one came close to that score. Additionally, it ensures that the metric used in scoring is more uniform, similar to what occurs when measuring height, weight, and other quantities on a ratio scale. In “The Golden Book of Intelligence”, there is a detailed description of how to perform these calculations, with illustrative examples for clarity.
The distribution of pIQ scores has properties different from those of rIQ, featuring a dense right tail and an asymptotic limit at 0. The rIQ does not have asymptotic limits on the x-axis, varying from -∞ to +∞. The graph below shows a comparison between the theoretical curve and the actual curve of IQ distributions:
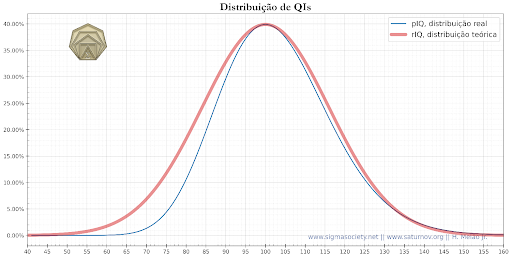
To better visualize the magnitude of the error in rarity levels calculated based on rIQs, we also plotted the distributions on a logarithmic scale:
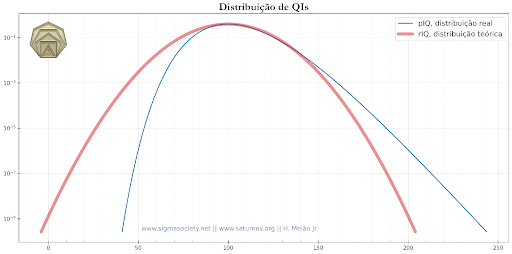
The actual level of rarity is many orders of magnitude different from the correct value for higher rIQs, although it is close to the correct value for rIQs below 135.
The table below shows the rIQs corresponding to pIQs in the range of 41 to 265 pIQ, which approximately covers the range from 0 to 214 rIQ:
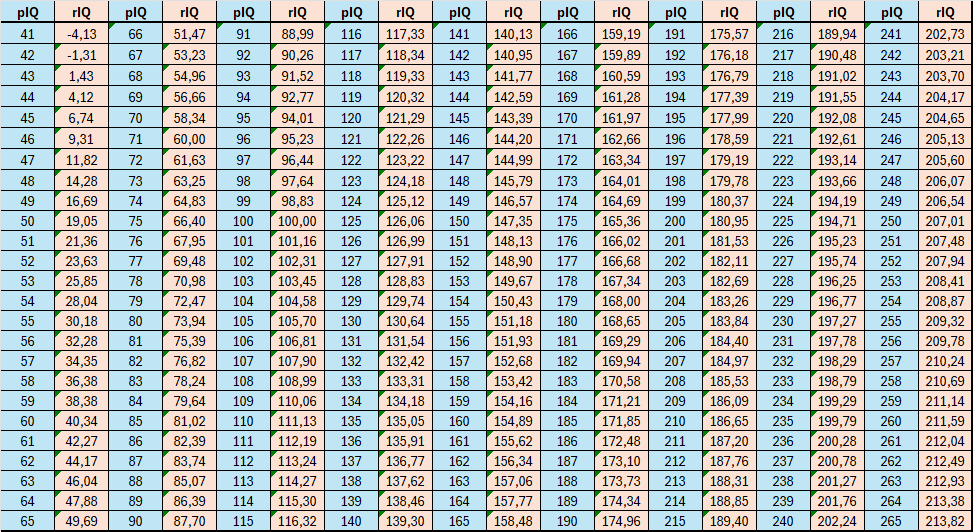
As can be seen, in the range of 90 to 140, pIQ and rIQ values are very similar, with differences of less than 2.5 points. However, above 159, the differences start to exceed 5 points and grow rapidly.
The nominal values measured by home tests are not exactly pIQ but are very similar to pIQ; however, they are interpreted as if they were rIQ and are statistically treated as if they were rIQ. Percentiles and rarity levels are calculated as if they were rIQ, resulting in significant distortions between actual rarities and the estimated theoretical rarities. Thus, a group of fewer than 10,000 tested individuals reports 13 scores at the 99.9999999th percentile (1 in 1 billion) and above, with some results reaching rarity levels of 1 in 10 billion or more.
Of course, a group of 10,000 selected individuals is very different from a group of random people, and this must be taken into account when analyzing this situation. It is also necessary to consider that at higher IQ levels, there is a greater likelihood that individuals will be motivated to take tests, as the reward serves as an attractive incentive. Therefore, in a group of only 10,000 self-selected individuals, a higher concentration of people with IQs far above average is expected, in a much greater proportion than would be observed in a non-select population. On the other hand, for a significant number of people with IQs near the global ceiling, the interest in spending time on these IQ tests is minimal, effectively excluding some of the world’s most intelligent individuals, such as Perelman, Witten, Wiles, Smale, Scholze, etc. Additionally, some of those with the highest scores, like Tao, were only evaluated in childhood. If home tests were administered broadly to all Fields Medalists, Abel Prize winners, Nobel laureates in Physics, Turing Award recipients, and other similar prize winners, how many people in the world would fall into the 99.9999999th percentile? The number would certainly be much higher than predicted.
Most Nobel laureates were only tested in childhood with tests capped below 150 or 160, making it difficult to correctly determine their IQs, and clinical tests overemphasize speed in solving elementary problems while not including truly challenging questions. This results in an inadequate ceiling of difficulty as well as a lack of construct validity above 140. Terman’s longitudinal study from 1926, which did not select the two Nobel laureates among its candidates and included none among the 1,528 selected, shows that traditional tests with a true ceiling near 130 work well up to that level but fail significantly in assessing individuals with IQs much above 150. Garth Zietsman’s study on the average IQ of Nobel laureates in science also shows major distortions, suggesting that Nobel winners have an average IQ of 154, implying that among every 3,000 random individuals, one would be potentially capable of winning a Nobel Prize, when in reality, the correct rarity is much higher. It is often argued that this occurs because the variable measured by tests is not the same as what is required to win prizes like the Nobel. Indeed, this is a serious issue because the Nobel Prize more accurately reflects intellectual level at the highest echelons than cognitive tests do. Cognitive tests, in fact, are unable to accurately measure scores above 150 and already show significant errors around 140. This issue is unrelated to pIQ and rIQ; it is another problem related to the lack of construct validity at higher levels and the use of questions with inadequate difficulty levels.
If the model used to convert rIQ to pIQ has parameter values reasonably close to the correct values, an IQ of 196 corresponds to an actual rarity level close to 1 in 2,200,000, and an IQ of 176 corresponds to 1 in 54,000. This does not mean that these scores on home tests reflect those rarity levels, as home test scores are not exactly in pIQ. Generally, in older home tests (by Langdon and Hoeflin), scores fall at an intermediate level between pIQ and rIQ, slightly closer to pIQ. In more recent home tests, the values are almost equal to pIQ and sometimes even higher. In the case of the Sigma Test, scores are calculated in both pIQ and rIQ, but since rIQ scores are determined based on correlations and calibrations with other tests, they are subject to the same distortions present in other home tests. Because rIQs on home tests for IQs below 140 are reasonably accurate, these can be used to establish reference points on the scale and then convert scores to pIQ, allowing for the determination of other values on the pIQ scale.
Therefore, ideally, all tests intended to measure IQs above 130, and especially above 140, should use the standardization method described in my 2003 article, explicitly calculating pIQ, then converting it to rIQ and correctly calculating the corresponding rarity levels.
In 2001 and 2003, I had already suggested this before there were any members in Giga Society. Now, with 13 members, the error is becoming more apparent. If a $2,000,000 prize were offered to anyone who achieved the score of 207 necessary for entry into Grail Society, instead of charging fees of $10 to $50, it is likely that those working on Clay Institute problems would dedicate substantial time to these tests, with a high probability that some would pass, making the error in the norms more evident, as people with theoretical rarity levels of 1 in 1 trillion or even rarer would start appearing. This has already happened—Dany Provost scored 236 (sd=16) on one of Paul Cooijmans’ tests, far exceeding the 207 required for Grail Society membership. Grail Society claims a cut-off at the level of 1 in 88,099,823,088, but among those who took Cooijmans’ tests, some have scored much higher than 207. Theoretically, only 1 in 105,490,408,417,274,112 people should reach 236, yet two have achieved this on Paul Cooijmans’ tests. Dany Provost was also tested with the Sigma Test and obtained an extraordinary result, ranking among the highest scores, qualifying for Sigma V, and was later invited to Sigma VI, though I am not permitted to disclose the result (the 236 score he obtained on Cooijmans’ tests became public when it was posted on the Giga Society website, so I see no problem mentioning it here).
Considering that Cooijmans’ tests have a relatively strong correlation with other high-range IQ tests, it becomes evident that there are significant errors not only in the norms of these tests but also in the rarity levels corresponding to each score. An additional issue with Cooijmans’ tests, which I explained in my 2022 interview for the In-Sight Journal, is that there are numerous errors in the answer key. These errors are not exclusive to Cooijmans’ tests; there are also many errors (and more severe and fundamental ones) in the WAIS.
IQ scores measured by most home tests are reasonably close to the “correct” values (in pIQ) near the ceiling and for much of the norm, but the corresponding rarity levels are grossly overestimated.
The graph below shows the difficulty levels (rIQ) of items on the Sigma Test (red), Titan Test (yellow), and Mega Test (blue):
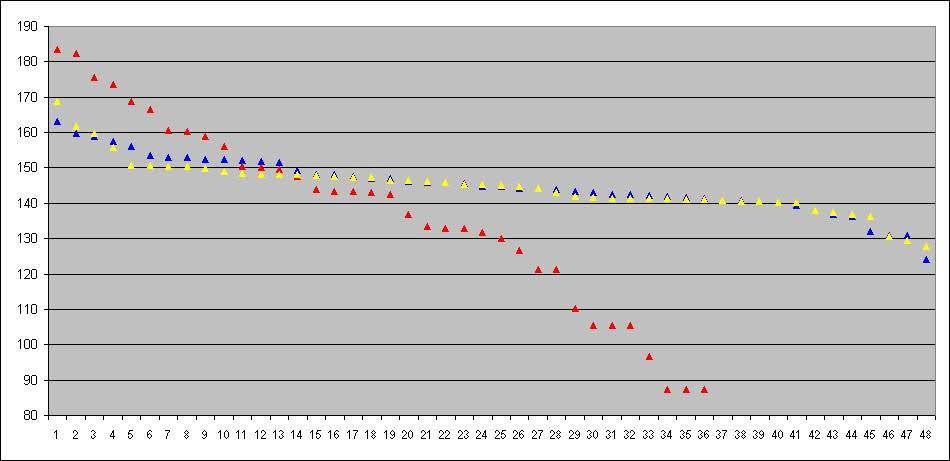
Both the Mega and Titan tests have a very large number of items with nearly the same difficulty level (between 140 and 150), which do not contribute to distinguishing skill levels above and below that range. Of the 48 questions, the Titan test has only 4 with a difficulty level above 150 IQ. The Mega test has 13 with difficulty above 150, but only 1 with difficulty above 160. The questions are interesting, but the difficulty level is not suitable for distinguishing scores above 170, and with great optimism, they might distinguish around 165.
The fact that the most difficult questions on the Sigma Test have a higher difficulty level than the hardest questions on the Mega and Titan tests does not necessarily mean it is more difficult to achieve a perfect score on the Sigma Test. An item with a difficulty rIQ of 150 means there is a 50% probability of being solved by a person with an IQ of 150. If 200 people with a pIQ of 150 try to solve this item, 100 of them will succeed, and 100 will not.
Therefore, when considering 2 questions with a difficulty level of 150, if they are not correlated, there is a 25% probability that a person with an IQ of 150 will solve both. If there are 3 questions that are uncorrelated, the probability of a person with an IQ of 150 solving all three drops to 12.5%, and so on. The more questions there are, the lower the probability of getting all of them right, even if they all have the same difficulty level.
When these questions are strongly correlated, the situation changes, and the probability of solving one or all of them becomes almost the same, depending on how strong the correlation is between them. For example, questions 21, 22, and 23 of the Sigma Test function almost as if they were a single question because many people who solve question 21 also solve questions 22 and 23. Question 23 is harder than 22, and 22 is harder than 21, but the general idea that leads to the solution of one is almost identical to what leads to solving the others. Therefore, these questions are very redundant and do not contribute much more to the discrimination level of the test than if only one of them were present. This comment also helps to better understand what I mentioned in the introduction of the STE about a very high Cronbach’s alpha being an undesirable characteristic, as it indicates high redundancy among the questions. In the STE, there are few questions with this problem, but in most tests, there are dozens or even all questions with this issue.
It is also important to clarify that solving 20 questions with a difficulty level of 150 is not comparable to solving 1 question with a difficulty level of 180. The probabilities may be the same in both cases, but the meanings are not. By analogy, one can think about the difficulty of obtaining a score of 160 on a timed test, where the questions are much easier than those on a home test, and compare it to the difficulty of scoring 160 on a home test. The probability of achieving IQ=160 may be the same in both cases; however, what is being measured in the timed test is not the same variable being measured in the home test. They are different competencies. Therefore, solving 20 questions with a difficulty level of 150 on a home test is not as reliable an indicator of an intellectual level of 180 as solving 1 question with a level of 180, even if the probability of achieving that level of correctness is similar. On the other hand, the uncertainty of the result based on only 1 question is greater than when based on 20 questions.
Obviously, solving 20 out of 20 questions is very different from solving 20 out of 40 questions, even if all have a similar difficulty level. However, it is not at all obvious that the interpretation of this differs for different IQ levels. For IQs below 140, solving 20 out of 20 is much more impressive than solving 20 out of 40, but for IQs above 200, solving 20 out of 20 or 20 out of 40 is not as different. This happens for several reasons: questions with a difficulty level of 150 often require “common” knowledge or knowledge that can be quickly acquired. At higher levels, questions typically require specialized knowledge. This creates challenges for individuals from one field to solve problems in another. For example, Einstein solved many problems with a difficulty level above 200, but if he were tasked with solving a set of 20 level-200 questions selected by someone else without considering his expertise, he might solve fewer than five. It would be like asking Perelman to prove Fermat’s Last Theorem or asking Wiles to prove Thurston’s Geometrization Theorem. Both would probably struggle. But if the questions were switched, they would likely succeed. If both were presented to Tao, despite his many significant achievements, it is possible that none of the problems he has solved would be as monumental as these.
At higher levels, choosing the problems one wants to work on requires different evaluation criteria. For Wiles, decades of study were necessary to master the tools, techniques, resources, and theorems needed to understand the parts of the problem already solved by his predecessors and then make further advancements. Understanding the problem and partial solutions discovered so far requires years or decades, and one cannot dedicate such time without strong motivation—usually driven by a deep desire to solve that specific problem. Tao works on problems that take less time to master, allowing him to solve more problems, but they are not as monumental as those tackled by Perelman and Wiles. Even at the level of problems Tao addresses, it takes at least a few months to master each topic, which also requires significant motivation. Therefore, presenting 40 such high-level problems and expecting someone to learn each one and devote months or years to solving them is unrealistic. An alternative is to create difficult problems that do not require years or months of study to master, but it is extremely difficult to design problems with these characteristics.
The STE tries to use questions that do not require extensive specialized knowledge, and where some knowledge is needed, a few days or hours are generally enough to learn what is necessary. This allows for a reasonable assessment at higher levels, although there are still criticisms to be made and some limitations to the test. However, it is perhaps the best tool for properly assessing IQs above 150 and certainly the best for levels above 170.
On the Miyaguchi website (http://miyaguchi.4sigma.org/), raw data from various people who took the Mega Test and Titan Test were available for download. Using this data, an estimate of the norms for these two tests was made using the method described in the 2003 Sigma Test norm article. However, the spreadsheets available on the Miyaguchi site do not provide results for all items for all test-takers, creating some biases in the results.
Raw data from other tests is not available online, so the 2003 study only considered these two psychometric instruments by Ronald Hoeflin and the Sigma Test itself. In the case of the LS60, if there are no errors in the answer key, the fact that no one has scored near the ceiling may indicate a higher ceiling than other tests. However, it would be necessary to ensure that all the answers in the key are indeed the best for each item so that “errors” are truly errors. This is important because many tests have significant flaws in their answer keys, as I mentioned in my 2022 interview with the In-Sight Journal and in some articles.
Even if the LS60 does not contain errors in the answer key, there would still be the question of whether the difficulty level of the items is appropriate and whether the questions truly measure what they are intended to measure. It would be useful to investigate the variation in Cronbach’s alpha as a function of item difficulty. If Cronbach’s alpha decreases near the ceiling of the test, this could indicate that the most difficult items are not discriminating correctly. A traditional item analysis could also help in this investigation. However, there would be other details to consider.
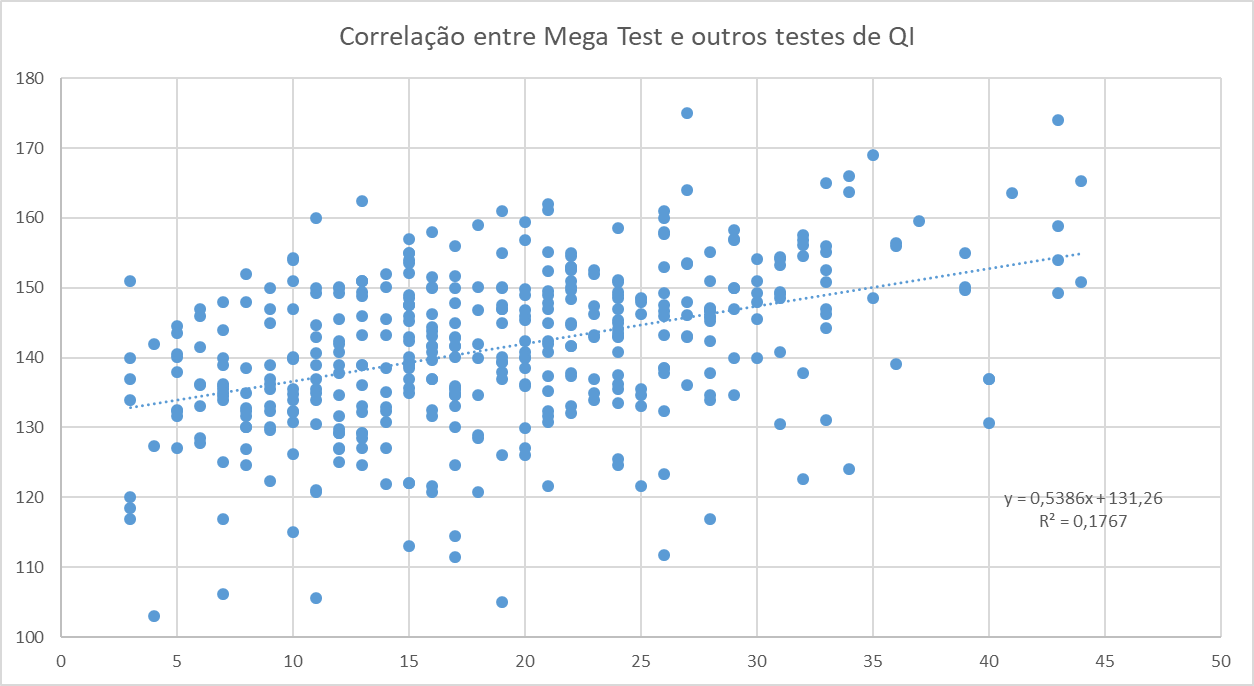
The correlation between the Mega Test and traditional IQ tests (pre-Omni) showed a relatively weak correlation (0.33) and was entirely determined by a single score: Marilyn’s. If her score is removed from the list, the correlation drops close to 0 and becomes slightly negative!

Without the 230 score (likely Marilyn’s):

The other sample of correlations presented on the site also shows a correlation of 0.33.
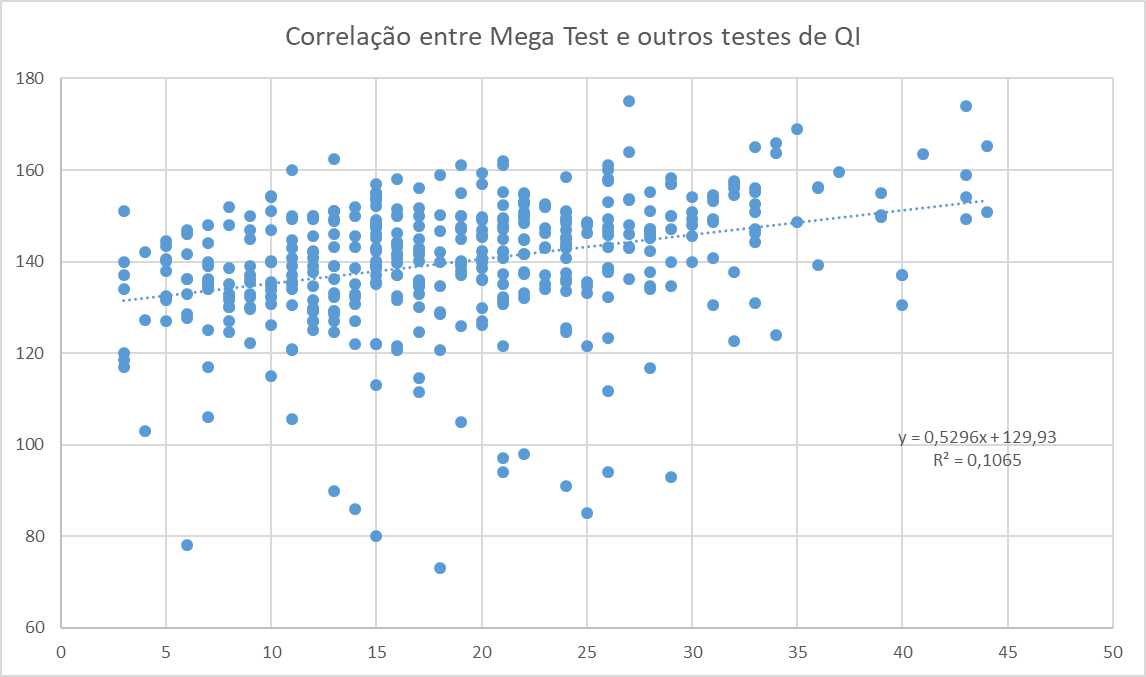
It is strange that a person with an IQ of 93 answered 29 questions correctly, while someone with an IQ of 151 answered only 3, a person with an IQ of 73 got 18 correct, and there are other anomalies. In the case of the person with an IQ of 151 who got 3 right, they might have thought it would take too long and submitted incomplete answers. In the case of the person with an IQ of 73 who got 18 correct, it is harder to explain—they might have received help from someone else, but it would already be unusual for someone with an IQ of 73 to be interested in taking the Mega Test. It is possible that the person provided a joke score for the 73 or intentionally answered incorrectly, as may have happened with Poincaré. In any case, it would be worthwhile for Hoeflin to filter these results suspected of error so they do not compromise the calculation of the norm.
The fact remains that there are evident errors in this data. The results presented on the site suggest that some individuals may have received help with solving the problems or may have reported an incorrect IQ score. Self-reports appear to be unreliable.
Without filtering these errors, the results suggest that the test ceiling is around 155 to 160, not 190+.
Removing scores below 100 increases the correlation slightly to 0.42, but the ceiling still seems to be around 155 to 160.
An interesting filtering method could be based on the distance on the y-axis between the scores and the regression line, removing scores with a distance greater than 2 or 2.5 standard deviations, repeating the process after each filtering as the parameters of the line would change with each iteration. The process would stop once the parameters stabilized. If removing 10% to 20% of the data did not stabilize it, the process would be halted after filtering to less than 80% of the original data. Other alternatives would be to use robust regression methods such as Tukey, Huber, or Hampel, or methods like LASSO or MLESAC.
The norms for the Mega Test and the Titan Test, based on the method described in the 2003 Sigma Test norm article I published at that time, suggest that the real ceiling of these tests is between 165 and 170. Bob Seitz mentioned arriving at a similar result. The old norm by Grady Towers suggests a ceiling near 200 and can be accessed here: http://miyaguchi.4sigma.org/hoeflin/megadata/gradynorm.html. Kevin Langdon also calculated a norm with a ceiling around 170, and more recently, in 2019, David Aly Redvaldsen calculated a norm where the ceiling is near 172.
The norm I calculated in 2003 may be biased because I used only the data available on the Miyaguchi site, which includes 500 and 519 scores out of a total of over 3,000. It is possible that the correct ceiling is slightly above an rIQ of 170, but it would hardly reach rIQ 180 or even 175. As for pIQ, it should reach about 190 or 200.
The data on the Miyaguchi site could be accessed on these pages:
http://miyaguchi.4sigma.org/hoeflin/megadata/megacorr1.html
http://miyaguchi.4sigma.org/hoeflin/megadata/megacorr2.html
Both the Mega Test and the Titan Test seem to me to be good psychometric instruments. More than that, they are groundbreaking, as they were, shortly after the LAIT, among the first to accurately measure IQs above 135 using questions with difficulty levels compatible with the intellectual level supposedly being measured. However, the calculation of percentiles from the scores is incorrect, and this error has been repeated and propagated widely.
Therefore, it is not enough for a test to be inherently good in the sense of having well-crafted questions and being well-standardized. It is also important to distinguish between pIQ and rIQ to avoid calculating rarity levels using absurd values, which create evident inconsistencies and compromise the credibility of some high-IQ societies by claiming to be in a percentile where they clearly are not.
A “good mental performance test” needs to have the following characteristics:
- Questions with varying levels of difficulty, compatible with the IQ range the test aims to measure.
- Questions that require different types of thinking. An excessively high Cronbach’s alpha (greater than 0.85, for example) is not an advantage. On the contrary, it may indicate that the questions are overly redundant and do not cover a sufficient variety of skills, but instead measure a very narrow and specialized set of abilities.
- A difficulty ceiling compatible with the IQ ceiling intended to be measured. This is one of the most common problems. Tests with an appropriate difficulty ceiling for IQs around 165 often have nominal ceilings of 190 or more, though their real ceilings are limited to about 170.
- Should not be culturally overloaded.
- If the test’s purpose is to correctly measure IQs above 130, it should not provoke errors through time constraints. Errors should be due to the real difficulty of the questions.
This list is not exhaustive but includes some of the most important criteria.
A test with dozens of very easy questions, such as the WAIS, Stanford-Binet, Cattell, or RAPM, may be suitable only for pIQs up to 135-140. Beyond this level, these tests only indicate which individuals with pIQs above 130 are faster at solving simple problems, but they do not differentiate between individuals with pIQs of 140 and 150, let alone distinguish those with pIQs much above 150.
These tests might indicate that individuals scoring 25/30 achieve a rarity level of 1 in 1,000, and those scoring 20/30 reach a rarity level of 1 in 200, but this does not mean that someone scoring 20/30 has an IQ of 140 and someone scoring 25/30 has an IQ of 150. Above the 140 level, the test is assessing which individuals with IQs of 140+ are faster. While speed correlates positively with intelligence, it is not a strong correlation and becomes weaker at higher levels. Thus, the person who scored 25/30 could indeed have an IQ of 150, but could also be an individual with an IQ of 140 whose speed is higher than 80% of others with an IQ of 140. In this case, they would be in the top 20%, or 1 in 1,000, while the person who scored 20/30 could have an IQ of 140 or even 150, 160, 170, etc., but their speed might be average for the group of people with 140 or slightly below the average for that group.
These distortions do not only occur at the 140+ level but at virtually any IQ level. The reason for highlighting this issue specifically at the 140+ level is that the distortions become much more significant beyond this point because deeper thinking becomes more crucial in determining intelligence than reasoning speed. A famous example of severe distortion is the IQ of Feynman, who scored 123, though his correct pIQ was likely around 220.
Therefore, a carefully standardized test, based on millions of test-takers, capable of theoretically discriminating at a level of 1 in 40,000,000 (rIQ 187), such as the Cattell III, would not be valid outside the IQ range of 60-135, unless the questions were difficult enough to correctly measure above 130, easy enough to measure below 60, and the number of casual correct answers (guessing all questions) was very different from the number of correct answers corresponding to an IQ of 60.
A well-standardized test, such as the Mega Test or Titan Test, can correctly discriminate at levels well above 135, potentially reaching pIQ 180 or pIQ 190. However, when calculating the corresponding theoretical percentiles, the results are far from accurate.
See also the original article in which I presented this standardization method in 2003, applying the same method to calculate the norms for the Sigma Test, Mega Test, and Titan Test: Archived Link
Some revisions to the 2003 text:
In the 2003 article, it states:
The estimated uncertainty at the ceiling of the Sigma Test, according to the 2003 article, is about 0.4 pIQ points (243.6 ± 0.4). A very interesting comment from our friend Albert Frank deserves to be included here and clarified. He roughly states:
“The difficulty level of question 35 of the Sigma Test is 66, but if tomorrow someone takes the test and gets this question right, the level would drop to 44. Therefore, the test ceiling cannot have an uncertainty of just 0.4.”
This comment is entirely relevant, but if question 35 of the ST has a weight of 66 and tomorrow someone answers it correctly and the weight drops to 44, this would affect the highest score by 4 points (from 206 to 202), and the other 5 people who had fractional points for partially correct answers would see a 0.2 variation in their IQs. The other IQs would not experience any change greater than 0.05. This might create the illusion that the highest scores have an uncertainty of 4 points and the ceiling would have even greater uncertainty, but that is not the case because the probability of the next testee answering this question correctly must be considered. If the probability were 1 in 2, then indeed there would be an uncertainty of about 2 points in the highest score. However, all available data suggests that the probability is around 1 in 67, so the uncertainty is much smaller than 4 points, probably around 0.06. This uncertainty is based on a single question. The combined uncertainty of the 36 questions should be approximately 0.06×350.06×35, or: 0.36. However, the method for estimating this uncertainty may be inappropriate. Still, the uncertainty is likely small across most of the scale from 100 to 200 (error less than 1 point) and could reach up to 5 points at the ceiling.
It is also important to consider that the value pIQ = 243.6 ± 0.4 is the uncertainty at the ceiling of the test, assuming that the parameters used in the calculation – s=0.1370s=0.1370 and k=10.041k=10.041 – are correct. The uncertainty at the ceiling is not the same as the uncertainty in the score of a person who scored at the ceiling, due to the probability of random success in each question, especially those with few “plausible” options. Although it is not explicitly a multiple-choice test, it functions in practice as if it were a test with few plausible alternatives. The uncertainty for each individual score is generally 5 to 10 points, but the uncertainty for each value in the norm is much smaller, generally E/N0.5E/N0.5, where EE is the average of individual errors and NN is the number of people tested.
First of all, it is important to clarify the difference between “precision,” “accuracy,” and “repeatability.” The accuracy of the test certainly does not come close to 0.4 points. The error is likely greater than 5 points, and in some cases, it could be greater than 10 points. Precision might be somewhat better. Repeatability—if the same person retakes the test, putting in maximum effort on the first attempt and not knowing which answers were correct on the second attempt—might have an error close to 1 point. In all cases, the error should be greater than 0.4. Therefore, there is an underestimation of the error in my 2003 article, and Albert Frank’s critique is correct in relation to the IQs of the assessed individuals, but not in relation to the values in the norm, whose uncertainty truly is around 0.4.
The difference between a person’s true IQ and the score generated by the test should be more than 5 points near the ceiling, and perhaps more than 10 points. Moreover, the error is likely to be strongly asymmetric (the downward error is much larger than the upward error). For example, a result of 210 might indicate a range between 190 and 215, with less upward dispersion than downward.
There are some additional errors and other details in the 2003 article that I may revise in the future.
Some recommended links:
Opinions on the 2003 Sigma Test norms and the new standardization method proposed:
http://www.sigmasociety.com/sigma_comentario-novo.asp
On ratio, interval, ordinal, and categorical scales: https://youtu.be/u9dXkSmfldo
2003 and 2004 Sigma Test norms, with the original version of this article:
https://web.archive.org/web/20060430090319/http://www.sigmasociety.com/artigos/norma_set_2004.pdf
Other articles and videos:
https://www.sigmasociety.net/artigos
https://www.sigmasociety.net/sigmatest-extended
https://www.sigmasociety.net/sigma-teste-light
https://www.youtube.com/@hindemburgmelao
Footnotes
None
Citations
American Medical Association (AMA 11th Edition): Melão H. On High-Range Test Construction 23: Hindemburg Melão Jr., A Ratio Scale for Cognitive Testing. November 2024; 13(1). http://www.in-sightpublishing.com/high-range-23
American Psychological Association (APA 7th Edition): Melão, H. (2024, November 22). ‘On High-Range Test Construction 23: Hindemburg Melão Jr., A Ratio Scale for Cognitive Testing’. In-Sight Publishing. 13(1).
Brazilian National Standards (ABNT): MELAO, H. On High-Range Test Construction 23: Hindemburg Melão Jr., A Ratio Scale for Cognitive Testing’. In-Sight: Independent Interview-Based Journal, Fort Langley, v. 13, n. 1, 2024.
Chicago/Turabian, Author-Date (17th Edition): Melão, H. 2024. “On High-Range Test Construction 23: Hindemburg Melão Jr., A Ratio Scale for Cognitive Testing’.” In-Sight: Independent Interview-Based Journal 13, no. 1 (Winter). http://www.in-sightpublishing.com/high-range-23.
Chicago/Turabian, Notes & Bibliography (17th Edition): Melão, H. “On High-Range Test Construction 23: Hindemburg Melão Jr., A Ratio Scale for Cognitive Testing.” In-Sight: Independent Interview-Based Journal 13, no. 1 (November 2024). http://www.in-sightpublishing.com/high-range-23.
Harvard: Melão, H. (2024) ‘On High-Range Test Construction 23: Hindemburg Melão Jr., A Ratio Scale for Cognitive Testing’, In-Sight: Independent Interview-Based Journal, 13(1). http://www.in-sightpublishing.com/high-range-23.
Harvard (Australian): Melão, H 2024, ‘On High-Range Test Construction 23: Hindemburg Melão Jr., A Ratio Scale for Cognitive Testing’, In-Sight: Independent Interview-Based Journal, vol. 13, no. 1, http://www.in-sightpublishing.com/high-range-23.
Modern Language Association (MLA, 9th Edition): Melão, Hindemburg. “On High-Range Test Construction 23: Hindemburg Melão Jr., A Ratio Scale for Cognitive Testing.” In-Sight: Independent Interview-Based Journal, vo.13, no. 1, 2024, http://www.in-sightpublishing.com/high-range-23.
Vancouver/ICMJE: Melão H. On High-Range Test Construction 23: Hindemburg Melão Jr., A Ratio Scale for Cognitive Testing [Internet]. 2024 Nov; 13(1). Available from: http://www.in-sightpublishing.com/high-range-23.
License & Copyright
In-Sight Publishing by Scott Douglas Jacobsen is licensed under a Creative Commons Attribution-NonCommercial-NoDerivatives 4.0 International License. ©Scott Douglas Jacobsen and In-Sight Publishing 2012-Present. Unauthorized use or duplication of material without express permission from Scott Douglas Jacobsen strictly prohibited, excerpts and links must use full credit to Scott Douglas Jacobsen and In-Sight Publishing with direction to the original content.

