On High-Range Test Construction 8: Bob Williams, The Tools of Intelligence Research

Publisher: In-Sight Publishing
Publisher Founding: March 1, 2014
Web Domain: http://www.in-sightpublishing.com
Location: Fort Langley, Township of Langley, British Columbia, Canada
Journal: In-Sight: Independent Interview-Based Journal
Journal Founding: August 2, 2012
Frequency: Three (3) Times Per Year
Review Status: Non-Peer-Reviewed
Access: Electronic/Digital & Open Access
Fees: None (Free)
Volume Numbering: 12
Issue Numbering: 3
Section: E
Theme Type: Idea
Theme Premise: “Outliers and Outsiders”
Theme Part: 31
Formal Sub-Theme: High-Range Test Construction
Individual Publication Date: August 15, 2024
Issue Publication Date: September 1, 2024
Author(s): Bob Williams
Author(s) Bio: Bob Williams is a Member of the Triple Nine Society, Mensa International, and the International Society for Philosophical Enquiry.
Word Count: 5,705
Image Credits: Kenny Eliason on Unsplash.
International Standard Serial Number (ISSN): 2369-6885
*Original publication here.*
*Please see the footnotes, bibliography, and citations, after the publication.*
Keywords: Arthur Jensen’s contribution to intelligence research, brain imaging advancements in intelligence study, Charles Spearman and discovery of g factor, conventional tests and IQ measurement methods, diffusion tensor imaging in brain connectivity research, genetics and heritability of intelligence, influence of environmental factors on IQ, measurement of physical parameters and intelligence, positron emission tomography in intelligence research, reaction time and its correlation with intelligence, structural MRI and cortical thickness studies, working memory tests and cognitive ability.
On High-Range Test Construction 8: Bob Williams, The Tools of Intelligence Research
The following is a tour through the various methods that have been devised and used to uncover the bits and pieces of insight that make up the present-day scientific understanding of human cognition and its differences among people. The point of this exercise is to identify tools and relationships that are not as well known as the ubiquitous IQ test.
Attempts to understand intelligence go back at least to Sir Francis Galton [1822-1911], who noted the heritability of intelligence, its difference between various populations, and its relation to physically measurable tasks. Following Galton, Charles Spearman contributed new statistical methods, insightful test designs, models of intelligence, and, most importantly, his 1904 discovery of g (also referred to as Spearman’s g, psychometric g, the general factor, and g). Over the course of the next few decades, g languished, while IQ tests were developed, studied, and refined to a point of high reliability and low bias. Numerous well-known researchers contributed models, tests, and understanding that were mostly based on the correlations between test scores and external factors (behavior, physiology, and life outcomes). It was not until Arthur Jensen began to explain the central nature of g that intelligence research shifted from earlier models to converge on g theory. Today, it is difficult to find a research paper that is not about, or constructed from, g theory.
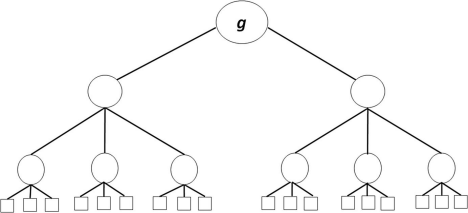
Above: Hypothetical example of hierarchical factor analysis
The investigation of intelligence can be sorted into four categories: conventional tests, external measurements with instrumentation, brain imaging, and genetics.
Conventional Tests
Although we are all familiar with some forms of IQ tests, they vary greatly and are designed for a variety of applications. Testing can be done over an age range from toddler to very old. At the young end of this range is the test methodology developed by J. Fagan based on selective attention to novelty (the time toddlers spent looking at new versus familiar faces). His method was predictive of adult IQ (r = 0.59) and adult educational attainment (r = 0.53). The Woodcock-Johnson is one of the broad ability tests that measures a specific number of abilities so that the traditional second-order factors [so-called “group” factors -Ed. Note] of the Cattell-Horn Carroll model will emerge; it claims to measure from age 2 to over 90. The Wechsler, various forms, is also a broad-based test, based on the CHC model, and is considered to be the gold standard (95 percent reliability) by many researchers.
A number of special-purpose IQ-test types have been developed. Some can be given orally to individuals who cannot write (as in an accident victim). Some are designed for speed of administration, taking only a few minutes. These latter group of IQ tests sacrifice range and accuracy for speed and are well suited when a coarse sorting is desired. The Wechsler Abbreviated Scale of lntelligence (WASI) is a well-known example of a test that has been shortened from its full form to achieve this objective. [The WASI is composed of two very highly g-loaded subtests (viz., vocabulary and matrix reasoning) as well as the similarities and block design subtests, rendering administration much speedier. A simple vocabulary test may be one of the most effective de facto IQ tests one could give in around ten minutes. Remember that cultural bias is an empirical question, and cultural bias is orthogonal to cultural load. Cf. Bias in Mental Testing -Ed. Note]
As most people have discovered, they are likely to score differently on different tests.This is largely due to uniqueness variance. IQ tests give reasonably close agreement of the latent factor g (when it can be computed), but the tests differ in content designed to produce broad ability factors and items that are either specific to the test, or due to random error. Specificity can result from content that is known to the testee (learned material) or is otherwise unique to the test. When a person is trained to take a category of test (teaching to the test), the specificity variance increases, thereby causing the g loading of the test to be somewhat lower.
The thing that ties IQ and other ability tests together is known as the positive manifold, which is the strong tendency of a person to score at a similar level on tests of largely unrelated abilities, such as vocabulary and block design. Spearman observed this and created the principle known as the indifference of the indicator, which was intended to point to the universal nature of g as a
general ability that appears in all cognitive abilities. Ergo, any test of cognitive ability is predictive of g, and all such tests are predictive of the same g (meaning that there are not multiple g factors). Cognitive ability testing is not limited to IQ tests. There are many tests designed to measure narrow abilities, without an attempt to link the scores to IQ.
Various tests of working memory capacity require the testee to retain representations, while performing tasks that make demands on working memory. He may be given a list of words or letters to remember, separated by a simple task, such as 3 + 5 = 7 (choose yes or no). Then he is asked to recall the list from memory. People are typically able to retain only a small number of representations (4 to 9) in working memory. The simple intermediate math operation effectively flushed out some of the working memory that was used to store the list of memory items. While this category of test is used as a subtest in some IQ tests [Editor’s Note: e.g, Working Memory Index on WAIS.], it is also used as a stand-alone tool when working memory is being studied. There are numerous other similar tools that are used for similar purposes.
One of the most interesting special-category tests is the Stroop Color-Word Test. While the test has three parts, it is the third one that demonstrates the Stroop effect. The testee is shown a list of typed color names, but each is printed in a different color ink than the name of the word, (RED is printed with blue ink, etc.). The testee is asked to name, as quickly as possible, only the color of the ink in which each word is printed, while ignoring the name indicated by the printed word.

Above: Stroop Color-Word Test
Here is what happens (from Jensen, 2006, Clocking the Mind: Mental Chronometry and Individual Differences): “Some individuals are so frustrated by the task requirement that they break down momentarily, while others stammer, stutter, gesticulate, clench their fists, or stamp their feet during this part of the test. Obviously, literate persons are unable to ignore the printed words even when they try their best to do so. Having to suppress their implicit response to the printed word makes it surprisingly difficult to utter the intentional response, viz., the actual color of the print.”
The purpose of the test is to measure the executive function or attention (ability to avoid distraction from a task). Research along these lines has linked the executive function, attention, working memory, and g. The details of their interdependence are not fully resolved, but they clearly share cognitive resources.
Measurement of Physical Parameters
The conventional tests, touched on above, are done with paper and pencil, a computer screen (acting as paper and pencil), or orally. These tests have been used for a majority of the studies of human cognitive abilities. They work and they can be altered to suit the specific mental process that is being studied. Most of them share one significant disadvantage: the tests cannot be scored on a true ratio scale (as is done with most physical measurements, such as force, voltage, mass, etc.). Instead, they have to be scored relative to a selected group of people.
In IQ tests, this is the norming group, and the test is scored by determining the z-score relative to the norming group distribution (IQ = [15 X z score] + 100). The resulting scores are a reasonable approximation of an equal interval scale (as used in the Fahrenheit and Celsius scales).
When physical measurements are used in intelligence research, the results are given on a true ratio scale, such as time, distance, volume, etc. It turns out that a great many of the things that can be measured by instrumentation (including clocks) are linked to IQ test scores and g.
Reaction Time (RT)
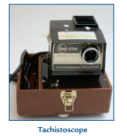
This measurement is usually done with a Jensen Box and consists of a home button (at the bottom center in the diagram), that the testee holds down, and various target buttons. When the testee sees the stimulus, such as one of the buttons being illuminated, he releases the home button and presses the target button.
Above: Jensen Box
Reaction time (RT) is measured from the onset of the stimulus to the release of the home button; the time from the release of the home button to the pressing of the target button is the movement time, but is of little value in studying intelligence. Both the RT and the standard deviation of RT are negatively correlated with intelligence, with the latter being somewhat more strongly correlated. RT measurements can be done in connection with a wide range of elementary cognitive tests (ECTs) and can be combined when a battery of these simple tests are given (each requiring less than a second to complete) to produce a measurement of g that is approximately equal to the g measurement from an IQ test. Each ECT has only a small g loading, averaging r = -0.35, but the variances are distinct enough to be added.
Galton performed RT measurements from 1884 to 1893, using a pendulum for the time measurement. His data has been compared to more recent RT studies; it shows that RTs have increased, suggesting a dysgenic effect (explored in detail by M. Woodley).
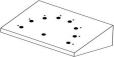
Inspection Time (IT)
Another widely used chronometric measurement is based on the shortest time that a person can recognize a change in the shape of a projected image. The standard image is somewhat like the letter pi (two vertical lines connected at the top). A cue is given to signal that the test is starting, then the test image is displayed, with one of the vertical lines shortened, then masked. The testee is asked which vertical line of the test image was longer. As the display time is reduced, a point is reached where the testee cannot reliably determine which line was longer. The testee’s inspection time is the point where he can achieve an accuracy of 97.5 percent. Again, there is a negative correlation (r = -0.54) between the speed of perceptual discrimination and IQ.
One of the important contributions made by IT was a study by T. Nettelbeck et al. that related to the Flynn Effect. He performed IT measurements for school children from the same school, using the same equipment.
The two sets of data were separated by 20 years. He also administered the same IQ test for the two groups. The expected IQ gain (Flynn Effect) was seen for the test scores, but the IT measurements were essentially identical, thus strongly suggesting that the test score gains were hollow with respect to g. I had the opportunity to ask him if there had been any changes in apparent SES, nutrition, or other discernible factors. He said that there was none, and the children were from the same community, school, etc. [Editor’s Note: This finding is fascinating and suggests the Flynn Effect could be largely chalked up to practice effects of some kind. Researchers have now found a reversing of the Flynn effect over the last thirty years in various countries, including Sweden, France, and Britain.]
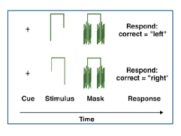
IT tests have traditionally been performed by means of a tachistoscope. It has a shutter and can project an image for a precise duration. When computer monitors were first tried for this task, the results were not reliable because of screen characteristics that allowed some people to read screen artifacts. With modern, very fast computer screens this problem has been solved.
Electroencephalography (EEG)
EEG has been widely used for medical diagnostics for head injuries, tumors, infections, and other disorders that relate to the nervous system. The measurements detect electrical activity in the brain by means of electrodes placed on the scalp; these are typically amplified and recorded on moving paper (creating traces). [Editor’s Note: Both EEG and MEG signals are possible because of the electromagnetic laws described by Maxwell’s equations, e.g., electrical currents produce an orthogonal magnetic field.] At one time, a good bit of intelligence research was carried out using EEG, but the number of papers reporting it has declined as newer measurement options have appeared.

Depicted above: Ionic current flowing in dendrites, producing an orthogonal magnetic field The magnetic field thus produced is reflected in EEG and MEG readings
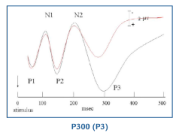
A primary focus of interest in EEG has been in the traces made following a specific stimulus. Since the traces contain large amounts of noise, they are repeated many times and averaged to produce the average evoked potential (AEP). The P300 latency, sometimes identified as P3, is one indication of intelligence. It correlates at about r = -0.36 with g. Another indication of intelligence is the complexity of the waveform. This is sometimes called string length since it can be measured by laying a piece of string over the wave tracing then measuring its length. Higher IQ is usually indicated by greater string length, but the strongest indication (per T. Bates, et al.) may be the difference in string length between high- and low-attention conditions, which is an indication of neural efficiency.
E.W.P. Schafer reported index methods that are based on the amplitudes of the AEP when the stimulus is related to neural adaptability and habituation (see: The g Factor for details of the procedures). These methods resulted in correlations as high as r = +0.82 with IQ tests. Although this methodology did not develop a following by other researchers, it demonstrates that g is closely related to the electrophysiological activity in the brain.
Other Biological Measures
Intelligence (g) is correlated with numerous other biological parameters that can be measured. (Cerebral glucose metabolism is one such measure and will be discussed later.) Nerve conduction velocity (NCV) is inherently related to the speed and efficiency of cognitive activity. NCV has been measured directly in the brain and in peripheral parts of the body. Peripheral measurements (for example, finger to wrist, and wrist to elbow) of NCV correlate with g in the range r = +0.41 to +0.46. Although most of these peripheral studies have produced the expected result, some have not, and at least one showed opposite results in men (r +0.63) and women (r = -0.55).
One of the most well-known of these physical measures is brain volume, which correlates positively with intelligence. Before brain imaging technology appeared, brain volume had to be measured by weighing a cadaver brain, or by estimating its volume from the skull volume (taken as the volume of lead shot or mustard seed that it will hold). Another indirect method of measurement is to take the head circumference or multiple measures of length and width to estimate the volume. While head measurements correlate at only r = +0.20 with g, the correlation is robust and has been repeated many times with large studies. One of the unexpectedly interesting papers that I have heard presented was Ian Deary’s calculation of the IQ of King Robert Bruce (paper presented in Amsterdam in 2007). I think Deary went through the somewhat-complex exercise to teach his students how to deal with data and errors. When it became possible to measure brain volume in a living person, via structural MRI, the correlation coefficient (volume of g) of r =+0.40 emerged. This number was later challenged and argued to be lower, but the challenge was subsequently refuted. The best estimate remains close to the initial finding. Brain volume remains an important intelligence parameter, as it relates to intelligence differences between species, between breeding groups (races), and between sexes.
Brain Imaging
Brain imaging technology is to the study of intelligence as the Hubble telescope has been to cosmology. Imaging has appeared in several stages, and each has opened new paths of study and huge gains in the understanding of intelligence.
Positron Emission Tomography (PET)
PET can be used to create images of the brain and various other organs. The thing that is seen as an image is the accumulation of a radioactive tracer (oxygen-15, fluorine- 18, carbon-11, or nitrogen-13) as the tracer is concentrated by the action of the organ being studied. As the tracer decays, it emits a positron, which collides with a nearby electron and causes the emission of two photons. The photons are detected externally.

Above: Positron Emission Tomography with presumed brain states
In the case of brain imaging, the image is effectively an integral of glucose uptake rate. The tracer used is fluorodeoxyglucose, which gives a time resolution of about 32 minutes. Thus, the image produced when a person is asked to perform a cognitive task is an integral over a time span of 32 minutes. The first use of PET to study intelligence was done by Richard Haier (presently editor of the journal Intelligence) in 1987. At that time, the cost of a single scan was $2,500. Haier financed the initial work by agreeing to do medical scans in trade for some research scans. His first subjects were given the RAPM (Raven’s Advanced Progressive Matrices) during the exam. Raw test scores ranged from 11 to 33 (out of a possible 36). The PET scans revealed the opposite of the expected result. The brighter subjects showed less brain activity (lower glucose uptake rates) than did the duller subjects. This was the first indication that one difference between brains of different intelligence levels was efficiency. The smarter brains solved the problems more efficiently. Decades later, we have numerous other imaging studies, using other technologies that have made similar findings and have added more detail to the initial study. One somewhat-easy-to-find refinement was that all brains show increased activity (effort) as problem difficulty increases, but less-intelligent brains reach a saturation point beyond which they cannot apply additional effort.
Haier also looked at the effect of learning, using the game Tetris. [Editor’s Note: Mega Society qualifier and mathematician Solomon W. Golomb’s game of pentomino directly inspired Tetris.] Several subjects were given practice sessions with the game (new at that time). They had not seen the game before and were restricted to uniform practice sessions. They improved their play score by a factor of 7. PET scans before and after the learning sessions showed significant reductions in brain activity in some parts of the brain. Haier wrote: “We concluded that with practice and improved performance, subjects learn what areas of the brain not to use, and this results in GMR (glucose metabolic rate) decreases.”
PET studies showed the value of being able to measure actual brain activity while subjects were performing mental tasks. The technology was expensive and had the slow 32-minute temporal resolution, so it was displaced when faster, MRI-based machines arrived.
Magnetic Resonance Imaging (MRI)
The first MRI was performed on a human in 1977. The machines are based on the use of a very strong magnetic field (5,000 to 20,000 gauss; the earth’s magnetic field measures 0.5 gauss) that is achieved by means of a superconducting magnet. A few years ago, R. Haier told me that there was an MRI machine that used a magnetic field that was significantly higher (ten times, as I recall) than other machines. He said some people complained of headaches and that the brain was warmed – probably causing the headaches. (A recent literature search shows that possibly even more powerful, new MRI scanners have been built. The reason for increasing the magnetic field strength is that it enables the voxel size to be reduced from 1 mm to 0.1 mm.)

MRI works by imposing an intense magnetic field around the area to be imaged using superconducting magnets. Hydrogen nuclei (protons) spin and have a natural magnetic polarity. When on, the magnetic field causes hydrogen nuclei to snap into axial alignment with the field.
A radio frequency wave is added and is pulsed on and off, causing the nuclei to snap out of alignment and then back in. This shifting of nuclei alignment causes a weak energy release (also a radio frequency wave), which can be detected by the MRI machine (via receiver coils that act as aerials) and used to create an MR image.
Structural MRI (sMRI)
This basic technology (the same as many have experienced in a medical setting) can be varied to allow various specialized forms of imaging. The most basic application for intelligence research is structural MRI, or sMRI. This is essentially a snapshot of the brain, but the image is 3D. It can be rotated and viewed from any angle and can produce a “slice” image of the brain at any depth. Since the image is in 3D, the points are also 3D, unlike the 2D pixels of a digital photograph. The 3D representations are known as voxels.
One of the problems encountered in understanding a brain image is that brains are not identical in size and shape. Yes, they are all generally the same in appearance, just as our faces are similar yet different enough that we can recognize them. A researcher must be able to compare brains, despite their differences. This can be accomplished by a computer using a process known as voxel-based morphometry. The process morphs the MRI data to fit a standard form and smooths the results so that they can be analyzed. For example, an area of great interest is cortical thickness. In order to study it and to compare different brains, the cortex representation has to be smoothed so that the folds are removed and the resulting artificial image retains the dimensions that are of interest, while losing the irregularities that would otherwise make it unmanageable.
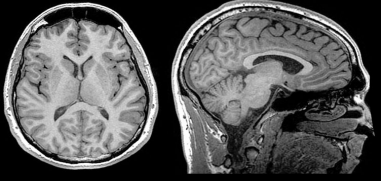
Above: Left image (axial view) and right image (sagittal view) of structural MRI
The cortex contains cortical columns that are vertical structures of variable length and composition. The number of these columns is related to cortical surface area, while their length is a function of cortical thickness. Their relation to intelligence is known primarily by the correlations found in average and local measurements of cortical thickness and in cortical surface area. A good bit of study of cortical thickness (CT) has been related to the NIH (National Institute of Health), e.g., the Study of Normal Brain Development.
One finding is that cortical thickness increases in early childhood, then begins a slow decrease around ages 7 to 10 years. When plotted against time, the trajectories of bright children (from longitudinal NIH data) show greater thickness at every age than for less bright children. During the first phase, thickness increases more rapidly in bright children, but exhibits a similar rate of thinning following the peak. This has obviously important significance in the verification of the high heritability of intelligence; the trajectories are set from early childhood. The strongest correlations between CT and IQ are found in the age range of 8 to 12 years.
The figure (below) of CT for different intelligence groups shows that there are differences and that they vary as a function of age. The illustrations of CT as a function of intelligence at the bottom of the figure also show how a brain appears after computer smoothing.
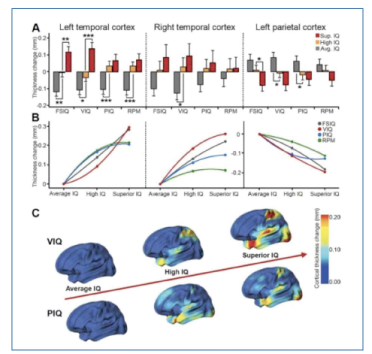
Above: Intellectual domain effects on cortical thickness changes as a function of IQ level. A, Cortical thickness differences between adjoining levels of IQ as affected by intelligence criteria and brain lobes. The superior, high, and average IQ groups were evenly divided according to four intelligence criteria, FSIQ, VIQ, PIQ, and RPM scores. The cortical thickness of each lobe is represented by the averaged value of all ROIs within the lobe. Sup., Superior; Avg., average. *p < 0.05; **p < 0.01; ***p < 0.001, two-tailed t test. B, C, Cortical thickness deviations from the thickness of the average IQ group used as zero reference. VIQ groups are better described by a linear or quadratic function, whereas PIQ groups are better described by a logarithmic one. The brain maps show absolute thickness changes at each cortical point, based on VIQ and PIQ levels.
When the thicknesses of specific locations are correlated against IQ, the results are different for men and women (a surprise to Haier and his team). The highest correlations (gray matter regions) in men were found in posterior regions, especially those related to visual-spatial processing. In women, the IQ-to-thickness correlation was almost entirely limited to the frontal lobes, especially in the language area (Broca’s Area). Findings that show sex differences have been frequent, and each strongly suggests the need to keep male and female data separate. Haier made this point to the International Society for Intelligence Research (ISIR) conference in 2006.
Functional MRI (fMRI)
MRI can be used to create images based on molecules containing iron, which is highly sensitive to the intense magnetic fields of MRI machines. Hemoglobin in red blood cells contains iron and iron molecules, thus connecting the fMRI images to blood flow in the brain. When a brain region is cognitively active, it will have greater blood flow, and this will be seen by the fMRI scan. The
fMRI process is fast, with thousands of images per second and a net resolution that is a span of about 1 second.
One of the applications for fMRI is the study of functional connectivity. When static measurements are made, the information conveyed relates to the function of a given brain region (functional segregation). But as imaging research progressed, brain regions were found to work together, such that a single region is necessarily involved in multiple functions. With fMRI, it is possible to see the connected activities of brain regions.
Using fMRI, it is possible to observe the brain performing a task over a period of time. Various regions show activity (increased blood flow) sequentially, as the brain deals with the task. In a conversation with R. Haier, he mentioned to me that fMRI data were proving to be difficult to use because of the large differences seen between individuals. This is not a problem with static imaging techniques, such as fMRI and diffusion tensor imaging.
Diffusion Tensor Imaging (DTI)
DTI is a different form of structural MRI. It is optimized to image the water content of white matter. The first study did not happen until 2005. Prior to then, white matter was relatively difficult to study. It was possible to measure white matter volumes and to do correlations with that and intelligence (revealing a large sex difference), but the details of how white matter tracts were organized were hidden. DTI has opened a new field of research-brain connectivity (wiring).Among the things that have been found are that the tracts form bands (in some places) that are composed of large numbers of parallel tracts; that each person has tract patterns that are as unique as fingerprints; that the primary cognitive centers are connected by massive highways of tracts, running from the frontal lobes to the parietal lobes; that connectivity is an indicator of IQ.

Above: Diffusion Tensor Imaging
When water movement is detected by the MRI process, it can be quantified as to the degree to which the molecules move in the same direction. This parameter is known as fractional anisotropy (FA) and is higher when the movement vectors are directionally similar. If FA is low, it indicates that the water movement is more diffuse, and this is taken to be an indication of low tissue integrity. Higher FA is a positive correlate of intelligence for both white and gray matter.
Magnetoencephalography (MEG)
Breakthroughs in instrumentation have continued to appear, offering new capabilities. Magnetoencephalography (MEG) is in some regards similar to EEG, in that sensors are placed on or very near the scalp. These highly sensitive superconducting sensors detect magnetic fields associated with neuron activity. The instruments are functional, in the sense of fMRI, but faster; they have a temporal resolution in the millisecond range. The precision of spatial location is excellent – sources can be localized with millimeter precision.
Unlike other methods of brain imaging, MEG is completely passive and is a direct observation of the brain, while other techniques are measuring secondary phenomena (isotope decay, water movement, etc.). MEG is thus totally safe and noninvasive.

When compiled into a movie, brain activity can be seen as a function of time. This was demonstrated (by Thoma) at the 2005 ISIR conference, showing the brain reacting to a simple optical stimulus. The activation areas appeared to bounce and flow from the extremes of the brain, in much the same way as water waves bounce and reflect when they are confined. When I saw this, there was an immediate revelation as to why something as simple as a light turning on would stimulate activity throughout the brain; this simple event, when measured by RT is significantly correlated with g. The video showed that the mental activity was complex and involved most of the brain volume.
MEG remains as a new tool with a limited history for intelligence researchers. It has great promise and is being evaluated by researchers. An example of an MEG movie, made while the subject is solving a test item from the paper-folding task, can be found here: http://www.cambridge.org/us/academic/ subjects/psychology/cognition/ neuroscience intelligence (select: student resources, then animations, then animation_4.3.mp4).
Genetics
Although Galton observed that intelligence was a family trait, the role of genetics in determining intelligence was not understood for many decades. In the 1960s, even scientists believed that intelligence was largely a product of the environment (books in the home, encouragement to excel in academics, etc.). When Arthur Jensen entered the field, that is exactly what he expected to find, but when he looked at real data, he saw a different story. The result was his 80-page landmark paper: “How Much Can We Boost IQ and Scholastic Achievement?” by Arthur R. Jensen, University of California, Berkeley, Harvard Educational Review, Vol. 39, No. 1, Winter 1969, pages 1-123.
From that point on, Jensen published a huge number of papers and books that addressed the issues related to demonstrating that intelligence is primarily the product of genes, with little environmental variance. Of the environmental variance that is found, it can be divided into the shared and the nonshared environmental factors. The former is that part of the environment that makes us more similar (family), and the latter is that part that makes us more different. There is a shared environmental variance in early childhood, but it vanishes by about age 12, leaving only the experiences people have as individuals (the following factors lower intelligence), such as: injury, disease, exposure to toxins, etc. From early childhood on, the heritability of intelligence increases (the Wilson Effect) into adulthood. By adulthood, the heritability of IQ is 85% and the heritability of g is 91%.
Although repeated studies have shown this high heritability of intelligence, attempts to find a single intelligence gene (or a few genes) have failed, despite methodologies that would have found it without doubt. This research has been led by Robert Plomin, who has authored numerous papers on the topic of the genetics of intelligence.
What is going on? The simple answer is that intelligence genes have been found, and each has accounted for only a percent or less of the total variance. As has been the case for other traits, intelligence is the product of hundreds or thousands of variants. For example, height has been shown to be determined by more than 900 variants. The two concepts that relate to this are pleiotropy (one gene affecting multiple traits) and polygenicity (many genes affecting one trait).
Genetic research will hopefully tell an increasingly complete story of which genes are involved, and how. To date, there is an impressive research category known as genome-wide association studies (GWAS). These studies include some with N of much more than 100,000 and at least one that is approximately 1,000,000. The GWAS studies have included genetic clusters that relate to intelligence, educational attainment, and behaviors throughout life. Because of the large N’s, the findings are robust, but they show small effect sizes.
A 2017 preprint (http://www.biorxiv.org/ content/early/2017/07/07/160291) showed 107 independent loci associated with intelligence, implicating 233 genes, using both SNP-based and gene-based GWAS. Further studies will surely appear, and the findings will presumably, if slowly, paint a picture of how intelligence is determined at the molecular level.
Further Reading
For those who are interested in reading original intelligence research papers, there is only one print journal dedicated to this subject: Intelligence. It is the official journal of ISIR and is the source of some of the best research papers. Another source that frequently contains top-quality work is Personality and Individual Differences. In the area of brain imaging, there are worthwhile papers in Neuroimage, Neuroscience, and Cortex.
The best book and DVD material that is relatively recent:
Haier, Richard J., (2017), The Neuroscience of Intelligence, New York: Cambridge University Press. This book is recent and was skillfully written to be easily readable, yet complete with respect to present-day understandings.
Haier, R.J., (2013), The Intelligent Brain, The Great Courses, Chantilly, Virginia (3 DVDs).
The first DVD is a review of non-imaging research. It then gets into the very interesting work that Haier and his colleagues have done.
Jensen, A. R., (1998), The g Factor: The Science of Mental Ability, Westport, CT: Praeger.
Written by the most outstanding intelligence researcher of the second half of the 20th century, this book was, and presumably still is, the all-time most cited book in this field.
For those who want excellent and accurate information that is written for public consumption (some exceptions), I strongly recommend the articles and papers by Linda Gottfredson. She has generously made virtually everything she has written available on her web page: http://www1.udel.edu/ educ/gottfredson/reprints.
Bibliography
None
Footnotes
None
Citations
American Medical Association (AMA 11th Edition): Jacobsen S. On High-Range Test Construction 8: Bob Williams, The Tools of Intelligence Research. August 2024; 12(3). http://www.in-sightpublishing.com/high-range-8
American Psychological Association (APA 7th Edition): Jacobsen, S. (2024, August 15). On High-Range Test Construction 8: Bob Williams, The Tools of Intelligence Research. In-Sight Publishing. 12(3).
Brazilian National Standards (ABNT): JACOBSEN, S. On High-Range Test Construction 8: Bob Williams, The Tools of Intelligence Research. In-Sight: Independent Interview-Based Journal, Fort Langley, v. 12, n. 3, 2024.
Chicago/Turabian, Author-Date (17th Edition): Jacobsen, Scott. 2024. “On High-Range Test Construction 8: Bob Williams, The Tools of Intelligence Research.” In-Sight: Independent Interview-Based Journal 12, no. 3 (Summer). http://www.in-sightpublishing.com/high-range-8.
Chicago/Turabian, Notes & Bibliography (17th Edition): Jacobsen, S “On High-Range Test Construction 8: Bob Williams, The Tools of Intelligence Research.” In-Sight: Independent Interview-Based Journal 12, no. 3 (August 2024).http://www.in-sightpublishing.com/high-range-8.
Harvard: Jacobsen, S. (2024) ‘On High-Range Test Construction 8: Bob Williams, The Tools of Intelligence Research’, In-Sight: Independent Interview-Based Journal, 12(3). <http://www.in-sightpublishing.com/high-range-8>.
Harvard (Australian): Jacobsen, S 2024, ‘On High-Range Test Construction 8: Bob Williams, The Tools of Intelligence Research’, In-Sight: Independent Interview-Based Journal, vol. 12, no. 3, <http://www.in-sightpublishing.com/high-range-8>.
Modern Language Association (MLA, 9th Edition): Jacobsen, Scott. “On High-Range Test Construction 8: Bob Williams, The Tools of Intelligence Research.” In-Sight: Independent Interview-Based Journal, vo.12, no. 3, 2024, http://www.in-sightpublishing.com/high-range-8.
Vancouver/ICMJE: Scott J. On High-Range Test Construction 8: Bob Williams, The Tools of Intelligence Research [Internet]. 2024 Aug; 12(3). Available from: http://www.in-sightpublishing.com/high-range-8.
License & Copyright
In-Sight Publishing by Scott Douglas Jacobsen is licensed under a Creative Commons Attribution-NonCommercial-NoDerivatives 4.0 International License. ©Scott Douglas Jacobsen and In-Sight Publishing 2012-Present. Unauthorized use or duplication of material without express permission from Scott Douglas Jacobsen strictly prohibited, excerpts and links must use full credit to Scott Douglas Jacobsen and In-Sight Publishing with direction to the original content.

